
01 / 07
Live portfolio dashboards
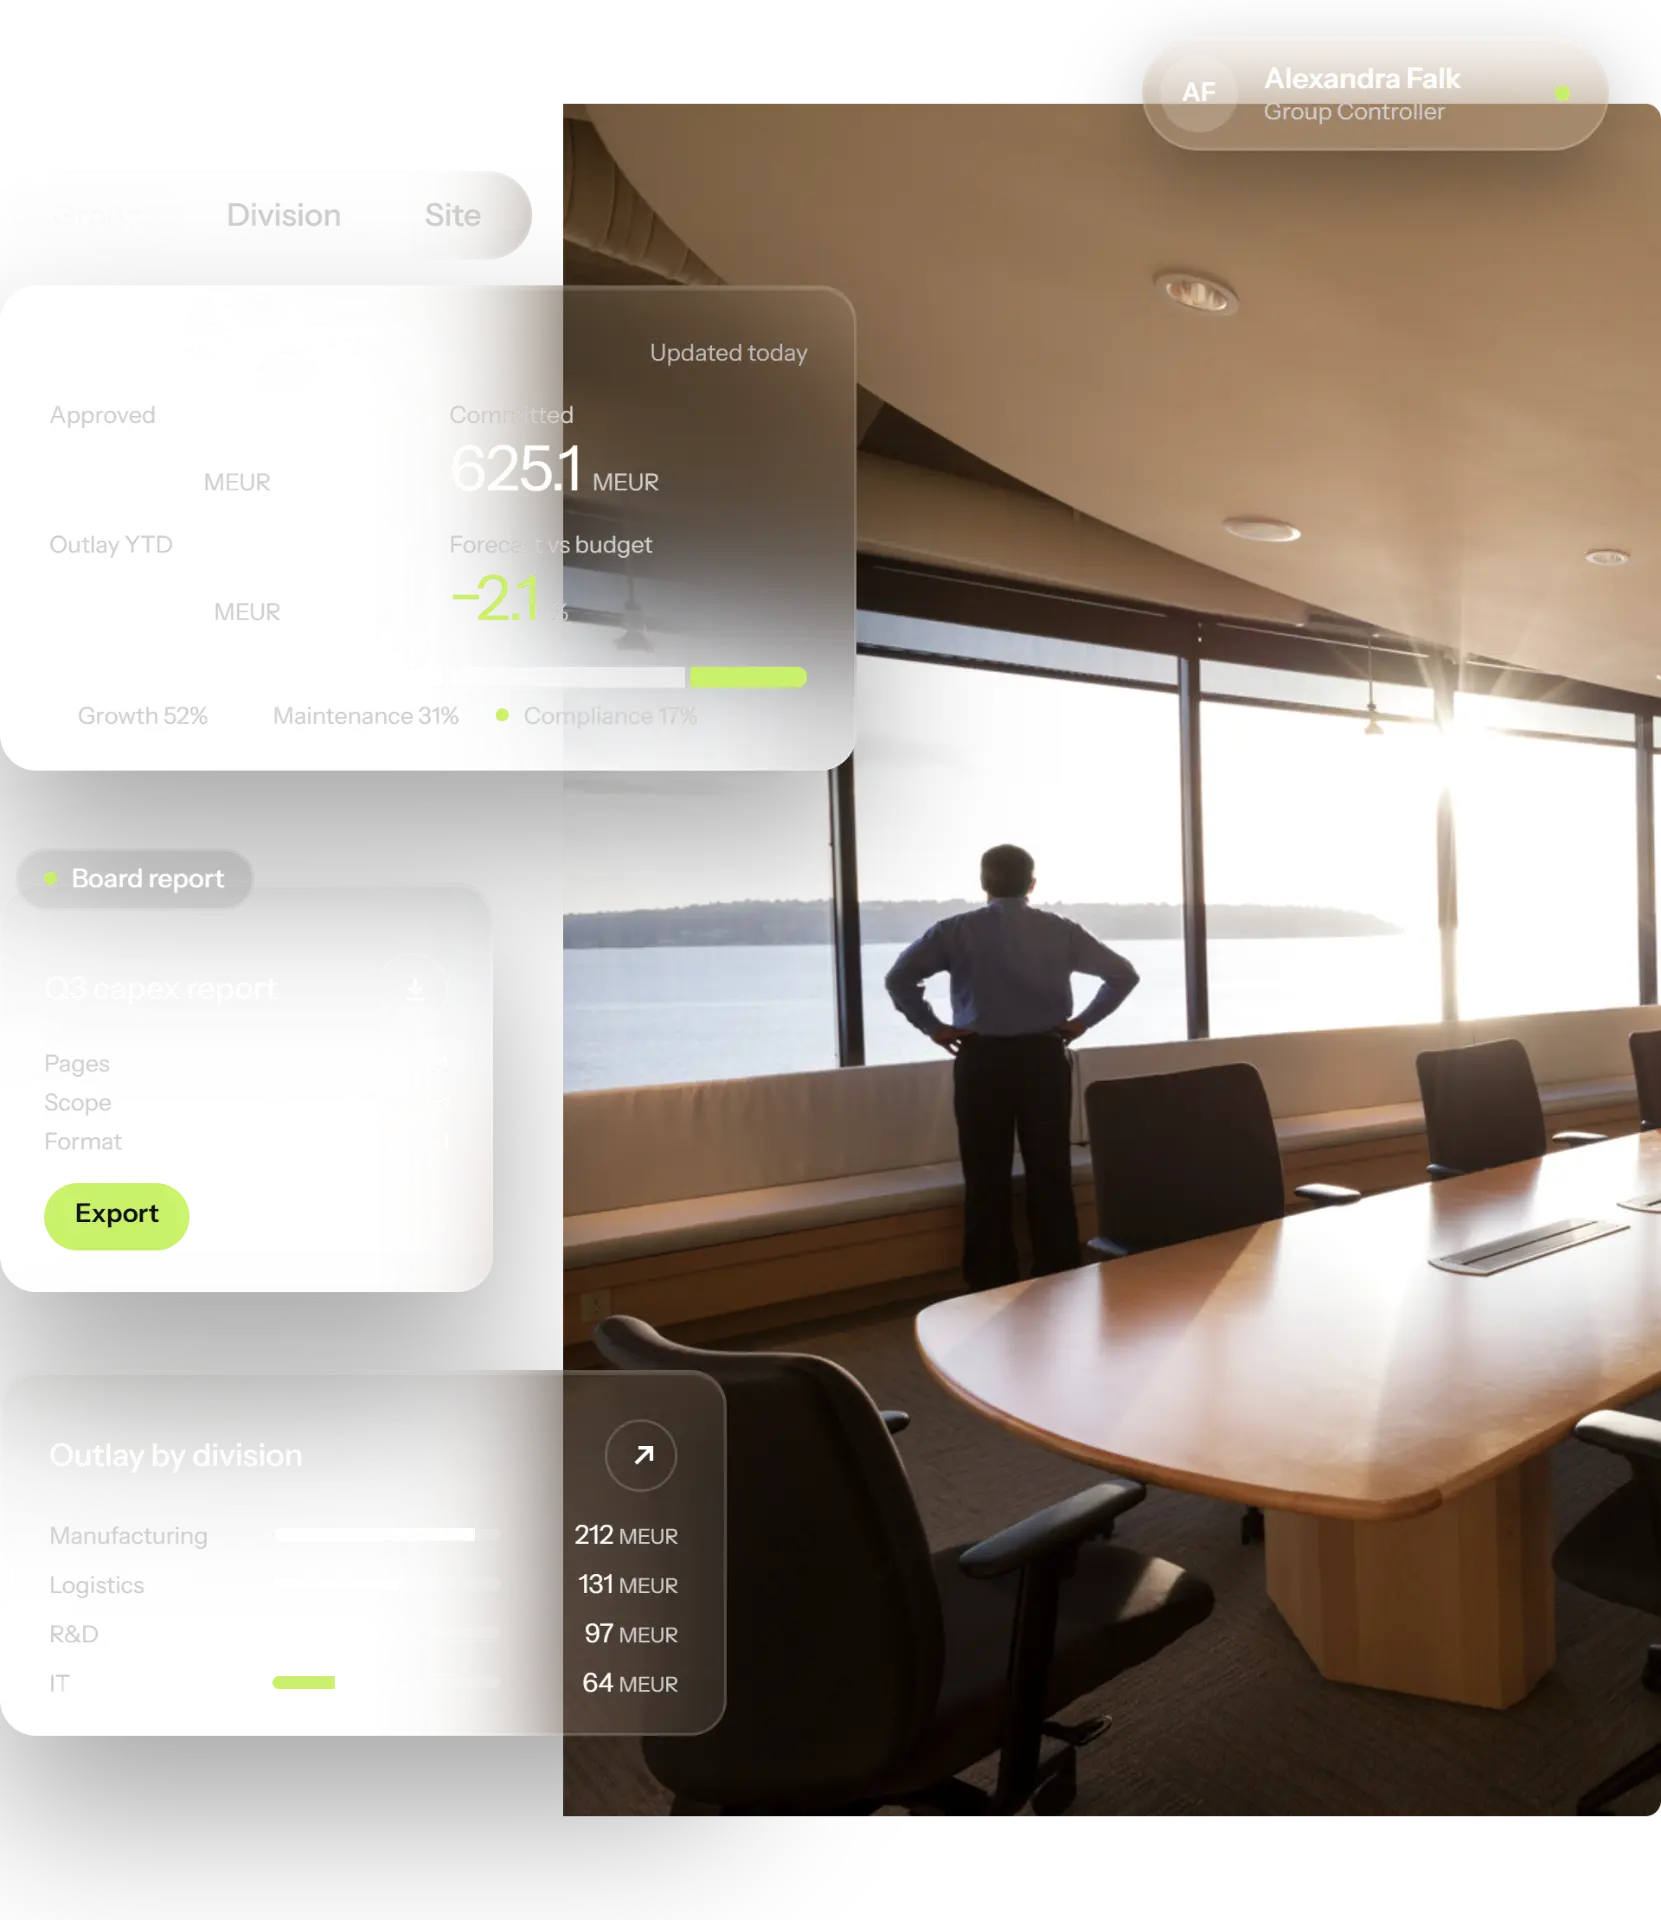
One current view of every investment: approved, in delivery and closed, across sites and business units.
Capex Platform · Reporting & Dashboards
Live portfolio dashboards built from the same governed data used to plan, approve and deliver capital investments, covering budget, actuals, forecast and deviation.
1
Source for budget, actuals and forecast
Live
Portfolio position, not month-end snapshots
ERP
Actuals synchronised, never re-keyed
Any
Roll-up by site, unit, driver or objective
What it does
Reporting is only useful if it is current, comparable and traceable back to a decision.
One current view of every investment: approved, in delivery and closed, across sites and business units.
The three numbers that matter, side by side, at project level and rolled up to the portfolio.
Each investment carries a live forecast, so the group total reflects where spend is heading, not where it has been.
Investments drifting from plan are flagged against thresholds instead of being found in a month-end review.
Save the views each audience needs, including site, business unit, group finance and board views, from one governed data set. Where a group already reports through Power BI or similar, the same data set can feed it.
The board view lives in Weissr, current and traceable back to the decisions behind it. Export to PDF or Excel when someone needs a file, not because the reporting has to happen somewhere else.
Connect Weissr to Claude or another AI assistant through MCP and ask questions of the portfolio in plain language, without building a report first.
How capex reporting works in Weissr
Requests, approvals, budgets, commitments, actuals and forecasts all live in the same portfolio record. Reporting reads from that record, so there is no export, no reconciliation and no version of the truth that only one analyst can reproduce.
Posted costs are synchronised from SAP, Oracle, IFS and other finance systems and matched to the investment they belong to, so actuals on the dashboard reconcile with the ledger.
Project owners update the forecast to completion as conditions change. Because that update lands directly in the portfolio, the group view moves with it rather than waiting for a consolidation cycle.
Every investment keeps its approved baseline. Variance is measured against that frozen figure rather than against a revised plan that has absorbed the overrun.
The same data aggregates by whichever dimension the question needs: how much of the envelope maintenance is consuming, what the growth programme is really costing, which site is carrying the deviation.
Weissr connects to Claude or another AI assistant through MCP, so questions of the portfolio are answered from the governed record itself, without building a report first.
Closed investments are compared against the case that justified them, so estimating accuracy becomes something the organisation can measure and improve rather than something it argues about.
What changes
Module
Govern approvals, spend and delivery in execution.
Related
Track cost, forecast and benefit from sanction to close-out.
Learn
The difference, and why it drives how capital is reported.
Module
The approved budget every report is measured against.
Module
Turn portfolio reporting into the next allocation decision.
Capex reporting
Capex reporting software presents capital expenditure data, including approved budget, committed spend, actuals, forecast to completion and investment status, in one current, portfolio-level view. It covers both individual investments and the portfolio as a whole, so finance leaders can see where capital stands and decide what to do next rather than reconstructing the position from spreadsheets each month. Because Weissr reports directly from the governed record used to approve and deliver each investment, the dashboard and the decision share one set of numbers, and variance is measured against the baseline that was actually sanctioned.
In Weissr, reporting is a capability that runs across Capex Management, Capital Budgeting and Capex Strategy rather than a separate product or BI layer. The reports use the same governed records the organisation planned, approved and delivered on, so there is no separate extract or reconciliation step.
A capex dashboard should show the approved budget, committed spend, actuals to date, current forecast to completion and the variance between them, broken down by site, business unit and investment driver. It should also flag investments that have deviated from plan and show how much of the annual envelope is still uncommitted.
Business intelligence tools visualise whatever data they are given. Capex reporting in Weissr is generated from the same governed records used to plan, approve and execute the investment, so the dashboard uses the figures the organisation approved, without a separate extract, reconciliation or manual refresh. Where a group already reports through Power BI or similar, Weissr can feed that data set too.
Continuously. Approvals, forecast updates and ERP actuals feed the same portfolio record, so dashboards reflect the current position rather than a month-end snapshot assembled by hand.
Yes. Portfolio and project views can be exported to PDF and Excel, and reporting views can be saved per audience, such as site, business unit, group finance or board, so each meeting works from the same underlying data in the format it needs.
CFOs and finance leaders use it for capital control, FP&A and capital planning teams for forecast accuracy, business controllers for site and business-unit oversight, and project owners for the status of the investments they deliver.
We can show your reporting cycle running on governed data instead of month-end consolidation.
Book a demo